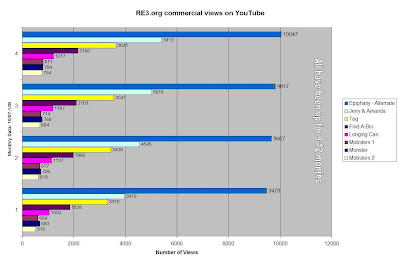
This graph shows the total number of times people have viewed one of our RE3.org commercials on YouTube over the last 3 months.
Most of these commercials have been posted for 12 months but we have only been tracking them for the last 3.

This graph shows the number of views per month for the top 8 RE3.org commercials. As you can see "Epiphany" is a real hit on-line.

This graph shows the total number of times people have viewed one of our Recycle Guys (companion campaign to RE3.org) commercials on YouTube over the last 3 months.
These commercials have only been posted for 6 months.

This graph shows the number of views per month for the top 5 Recycle Guys commercials. As you can see "In the Rollcart" is everyone's favorite.

This graph depicts the number of unique visitors to RE3.org. I was trying to show how paid media might be driving people to our Web site. I think the incentive program we conducted with Time Warner and MTV caused the number of hits to increase in September 2007.

This graph shows the number of unique visitors to the Recycle Guys Web site. We can only assume the spike each year in October is due to our interactive, fun, skeleton craft page we put up for Halloween. This is why we now have a new craft page each month.

No comments:
Post a Comment